Chapter 3 Graph Types
We explore 6 simple Graph Types.
- Bar Plot
- Histogram
- Box Plot
- Scatter Plot
- Facet
- Maps
3.1 Bar Plot
The Bar Plot examines the distribution of a Categorical Variable.
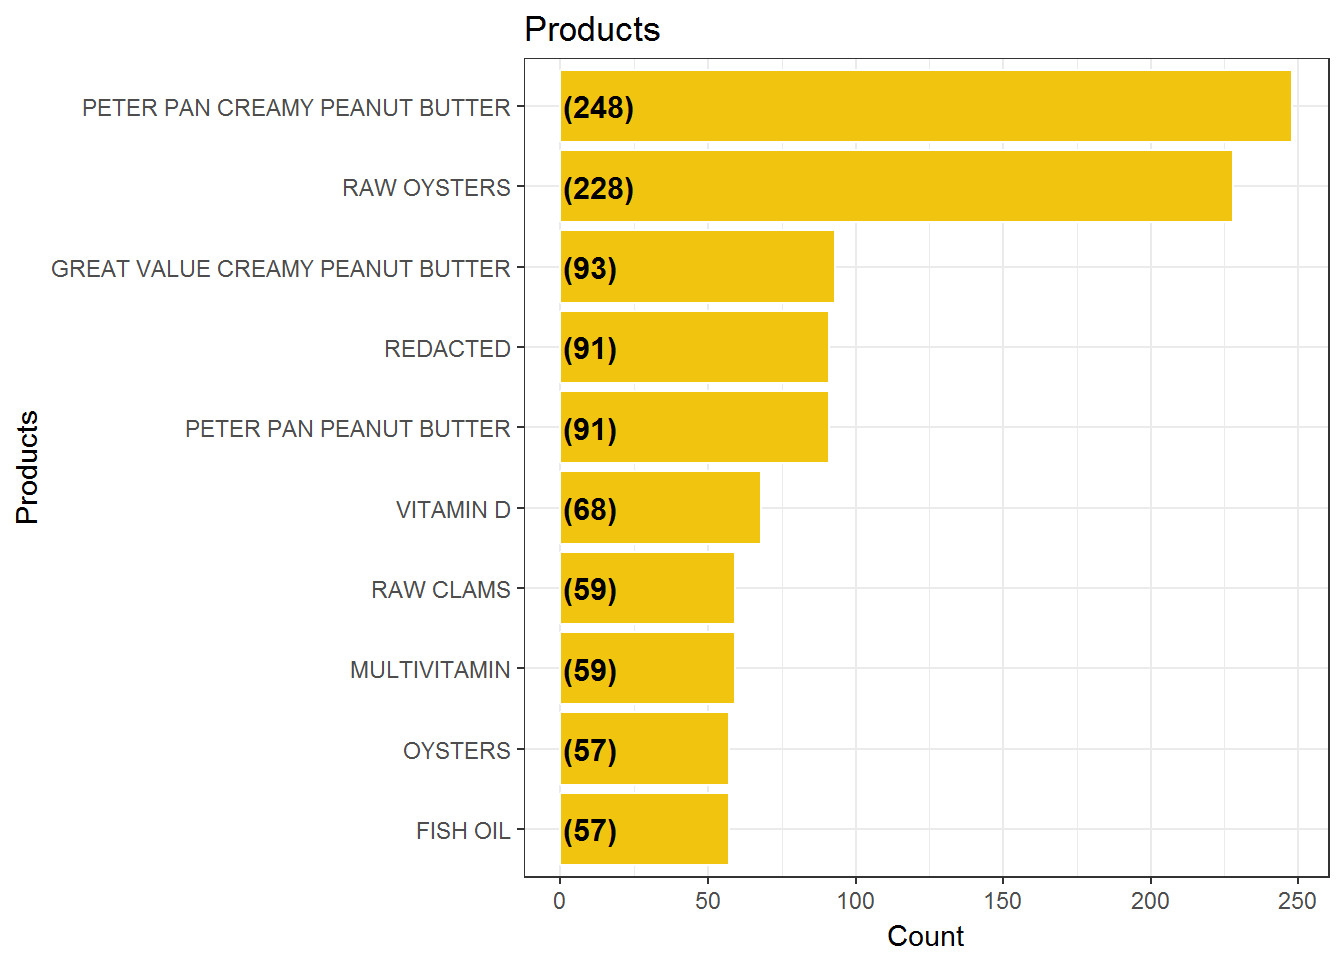
Example of BarPlot
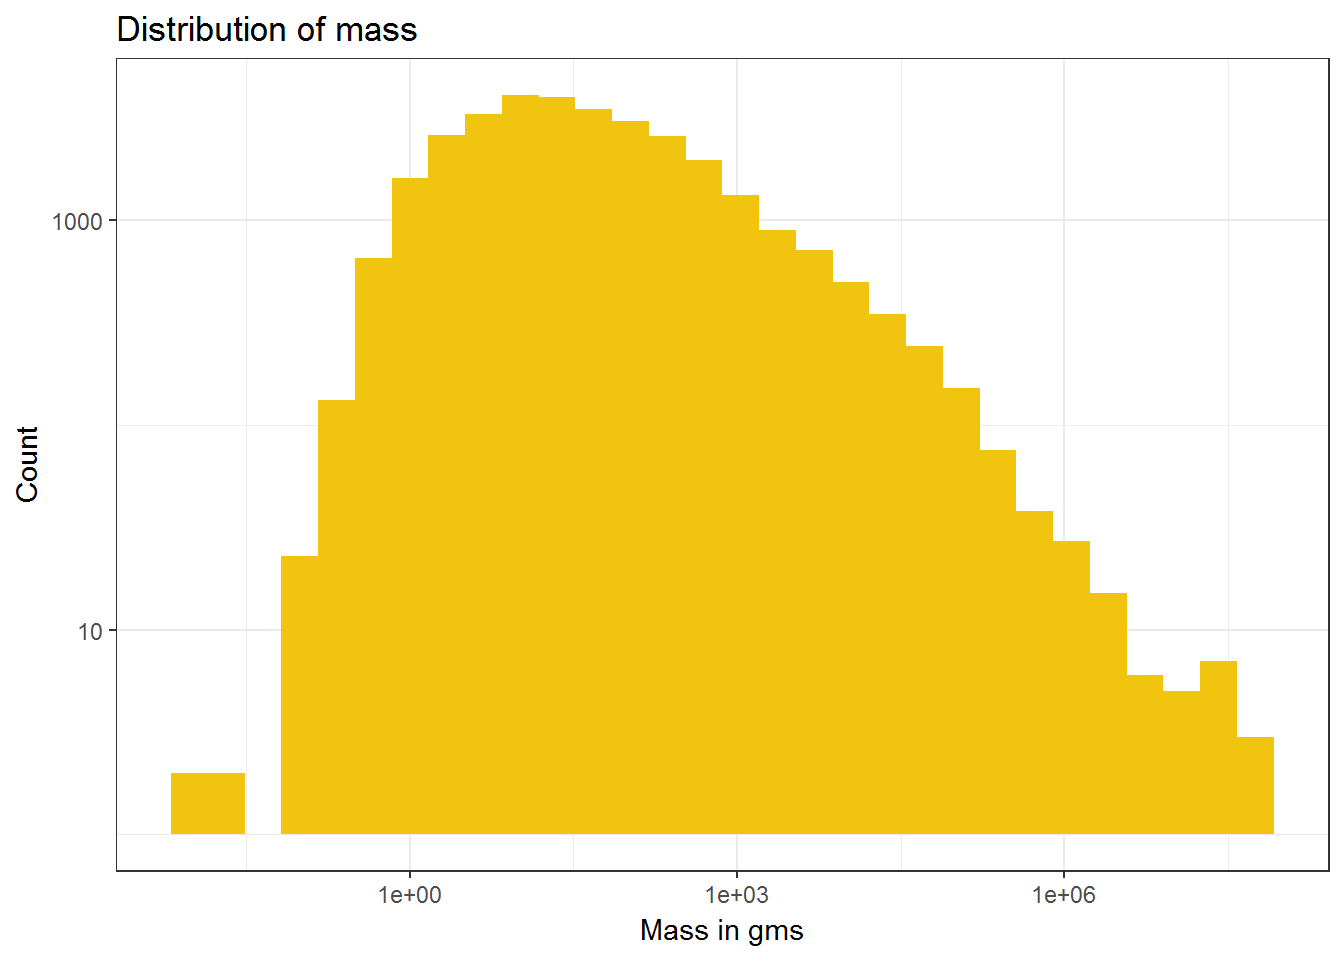
3.2 Histogram
The Histogram examines the distribution of a Continuous Variable.
3.3 BoxPlot
When we have a Continous variable and a Categorical variable and we wish to examine the distribution of the Continous variable seperately for each of the categorical variables, a box plot can be used.
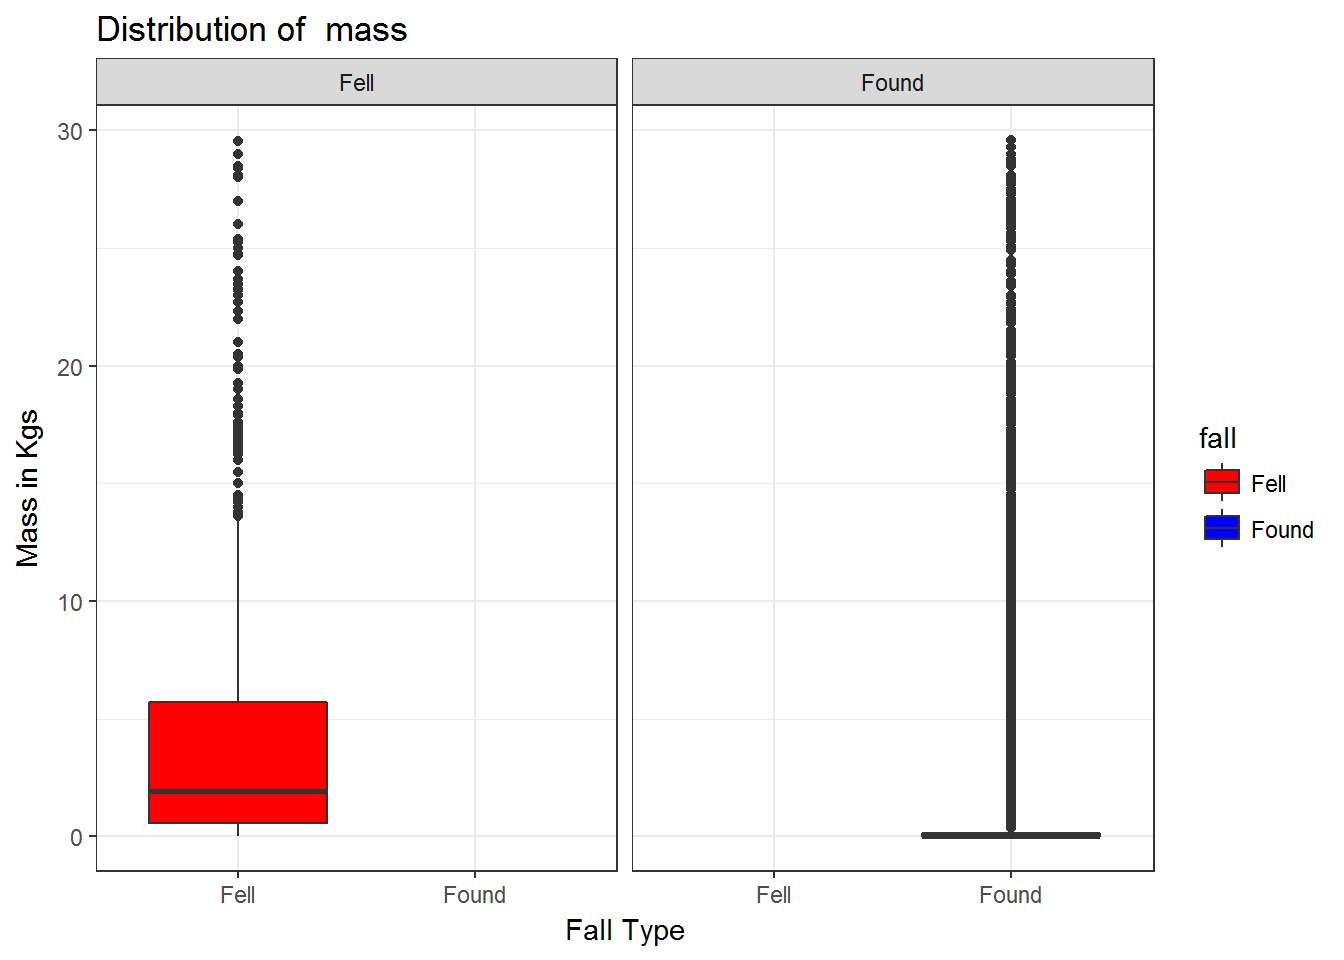
Example of BoxPlot
3.4 Scatter Plot
A Scatter Plot has points that show the relationship between two Continuous variables.
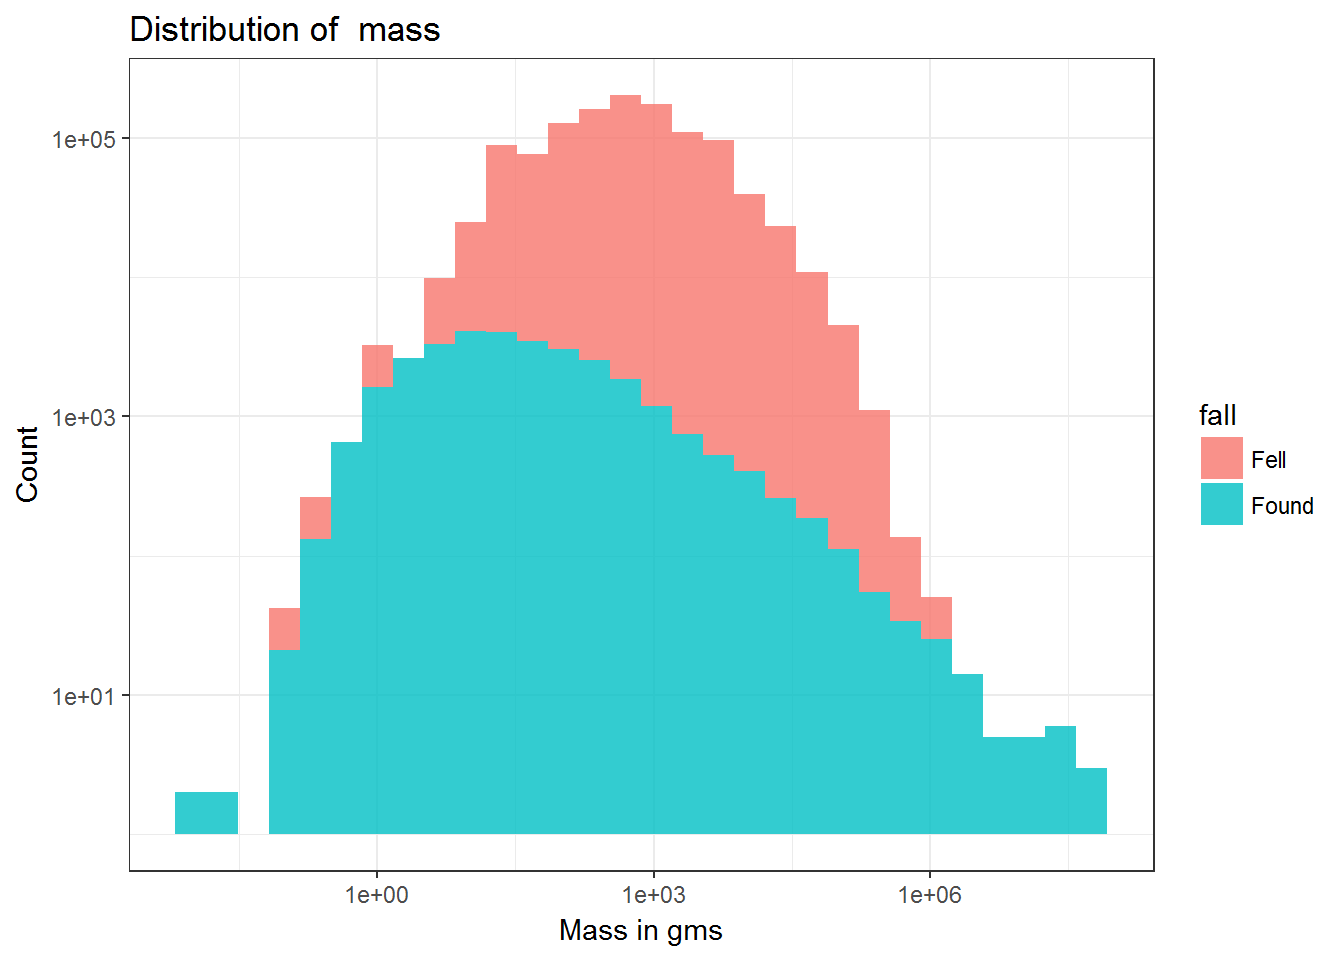
3.5 Facet
When we wish to seperate the distribution of a variable ( categorical or continous ) based on another categorical variable, a facet is used. A facet histogram and a facet barplot can be used.
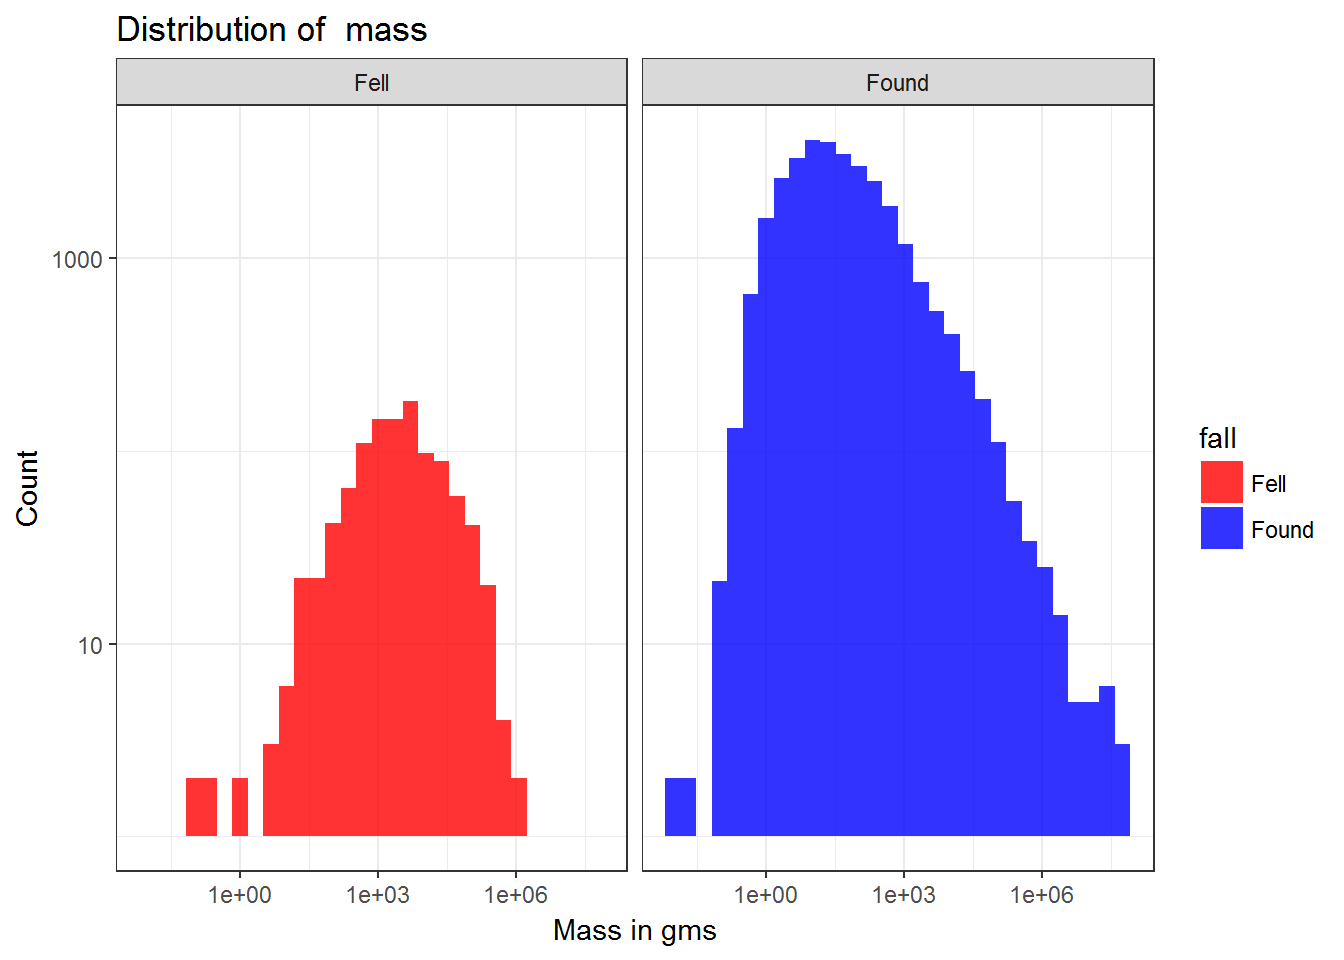
Example of Facet
3.6 Maps
We overlay the data on the latitude and longitude of the world and see various patterns based on this.