Chapter 7 Total Votes for a Hidden Gem
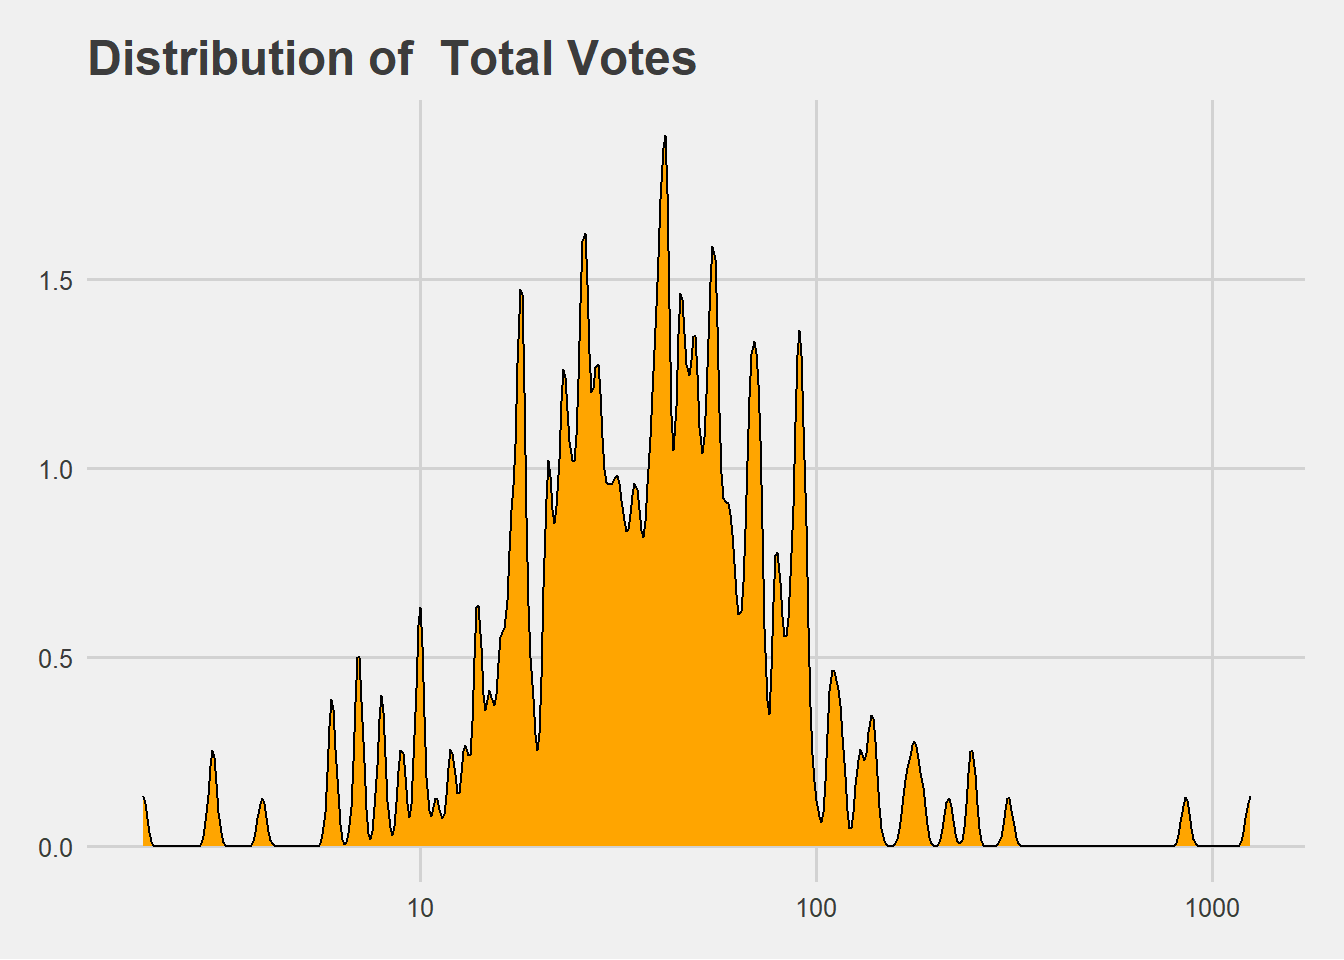
The following plot shows the distribution of Total Votes for a Hidden Gem.
Minimum number of votes is 1
Maximum number of votes is 1246
Median number of votes is 39
95% Confidence Interval for a Hidden Gem Votes is between 44 and 65
7.1 Box Plot ( without Outliers )
kvcs %>%
  filter(!is.na(TotalVotes)) %>%
  filter( TotalVotes < 400) %>%
      ggplot(aes(x = TotalVotes, fill = fillColor2)) +
      geom_boxplot() +
      labs(x= ' [Total Votes]',y = ' [Count]', title = paste("Distribution of", ' Total Votes ')) +
      theme_fivethirtyeight() +
theme(legend.position = "none") 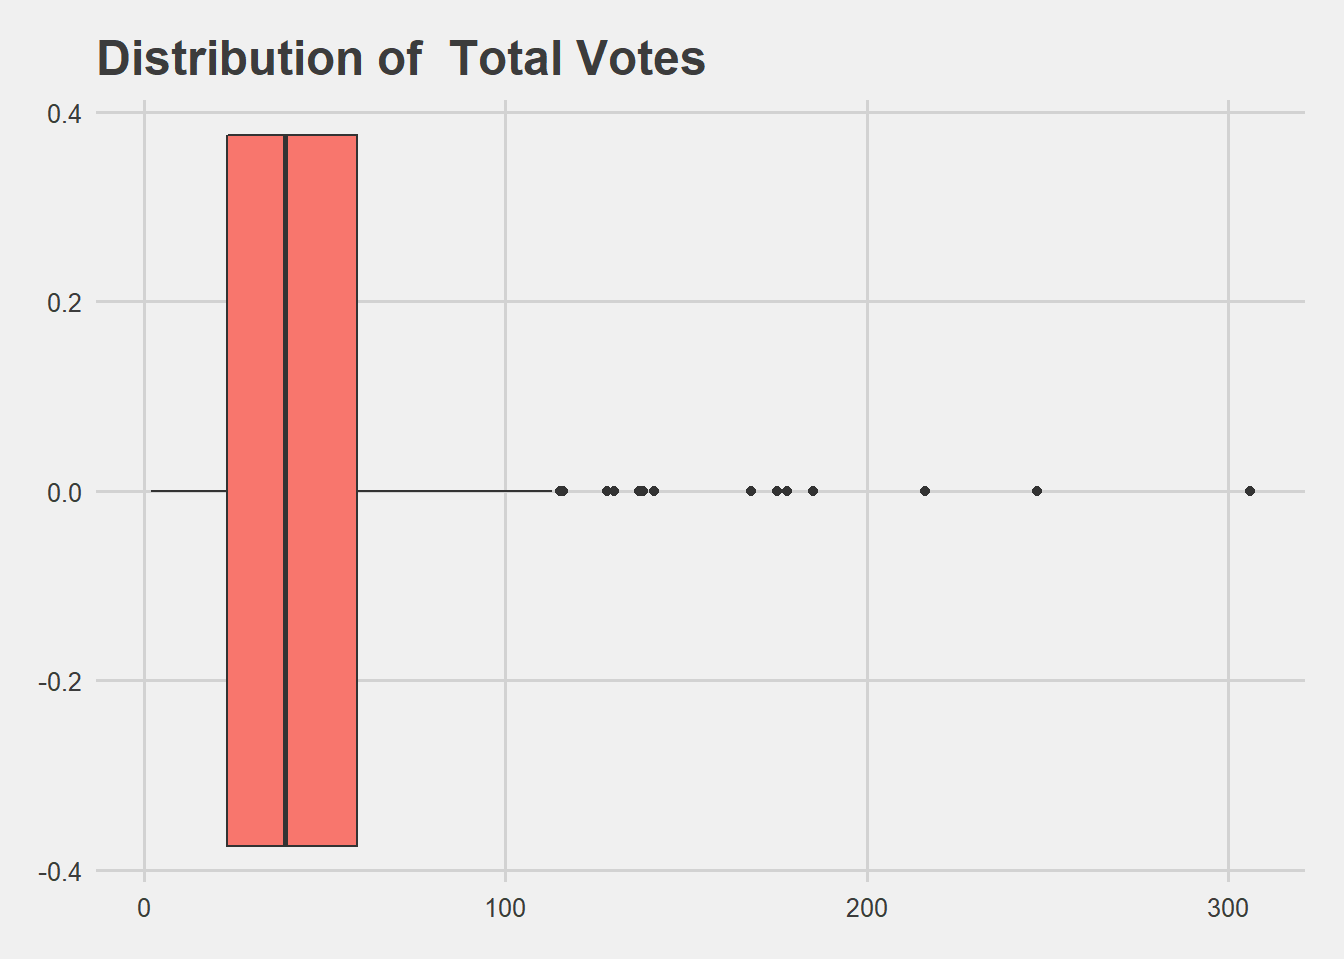
7.2 Box Plot
kvcs %>%
  filter(!is.na(TotalVotes)) %>%
      ggplot(aes(x = TotalVotes, fill = fillColor2)) +
      geom_boxplot() +
      labs(x= ' [Total Votes]',y = ' [Count]', title = paste("Distribution of", ' Total Votes ')) +
      theme_fivethirtyeight() +
theme(legend.position = "none") 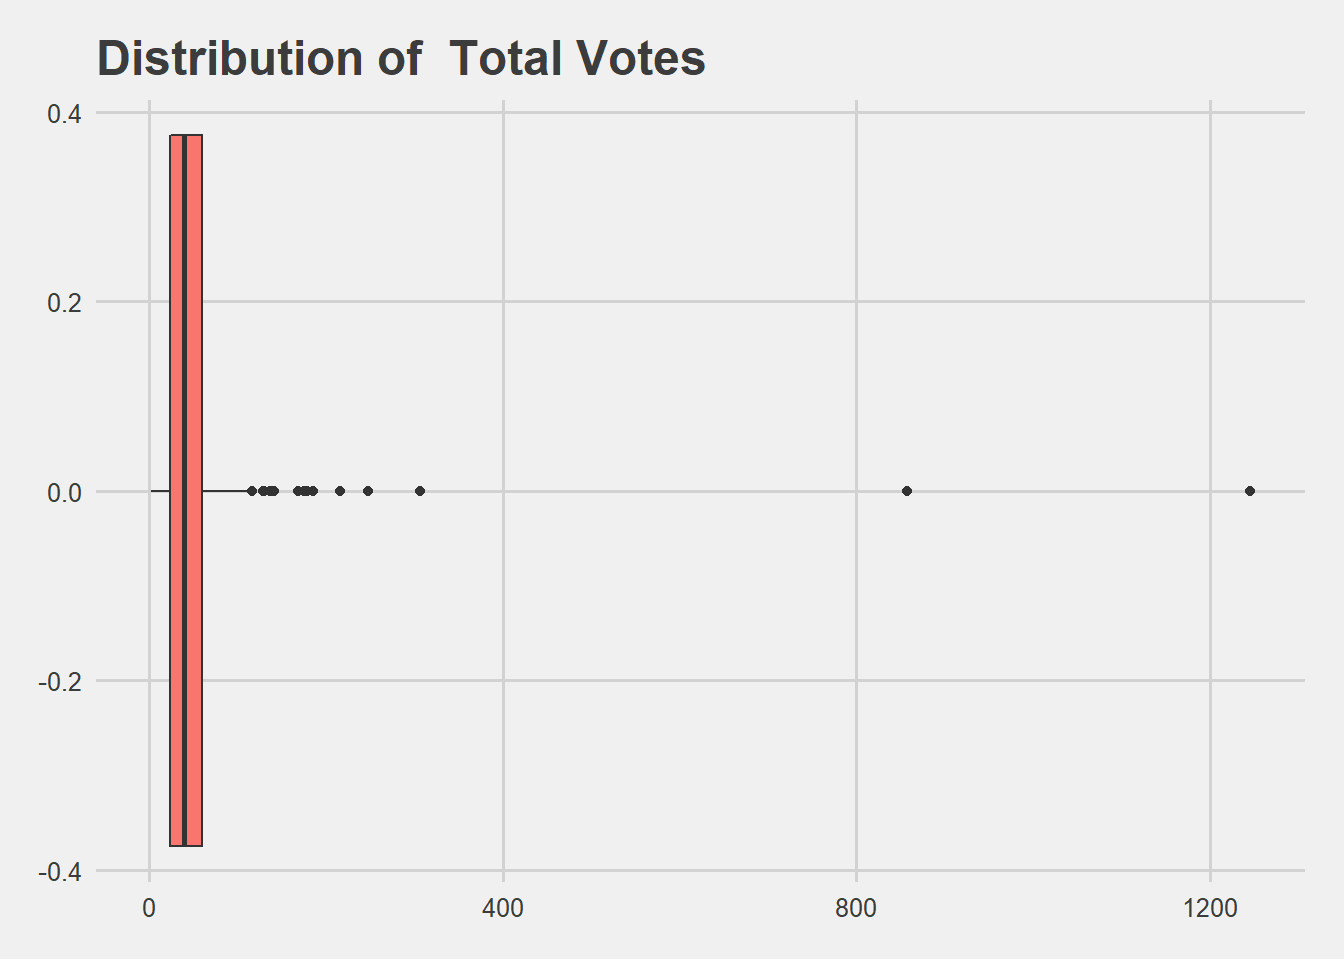
7.3 Density Plot
kvcs %>%
  filter(!is.na(TotalVotes)) %>%
      ggplot(aes(x = TotalVotes, fill = fillColor2)) +
      geom_density(fill = "orange", bw = 0.01) +
      scale_x_log10() +
      labs(x= ' [Log Total Votes]',y = ' [Count]', title = paste("Distribution of", ' Total Votes ')) +
      theme_fivethirtyeight() +
  theme(legend.position = "none")